
OpenStack Pure Vs Ceph Performance Test result
- Dec 3, 2017
- 1 min read
I took a sample output and plotted the chart to compare the performance of Pure vs Ceph. Seems like pure is 13.25% more performance than Ceph distributed Storage system. fio did a total of 1GB of IO at, for Pure - 227.35 MB/s for a total of 58,202 IOPS (at the default 4k block size), and ran for ~9 seconds (9.00798 Seconds) for Ceph – 17.17 MB/s for a total of 4,394 IOPS (at the default 4k block size), and ran for ~2mins (1.9878 Minutes)

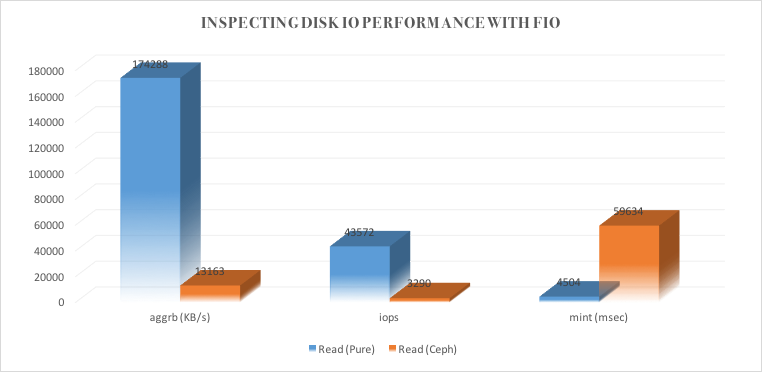
The total throughput and time. io= indicates the amount of IO done in total. aggrb is the aggregate bandwidth across all processes / devices. minb/maxb show minimum/maximum observed bandwidth. mint/maxt show the shortest & longest times for tests. PureStorage
READ: io=784996KB, aggrb=174288KB/s, minb=174288KB/s, maxb=174288KB/s, mint=4504msec, maxt=4504msec WRITE: io=263580KB, aggrb=58521KB/s, minb=58521KB/s, maxb=58521KB/s, mint=4504msec, maxt=4504msec read : io=784996KB, bw=174289KB/s, iops=43572, runt= 4504msec write: io=263580KB, bw=58521KB/s, iops=14630, runt= 4504msec CEPH
READ: io=784996KB, aggrb=13163KB/s, minb=13163KB/s, maxb=13163KB/s, mint=59634msec, maxt=59634msec WRITE: io=263580KB, aggrb=4419KB/s, minb=4419KB/s, maxb=4419KB/s, mint=59634msec, maxt=59634msec read : io=784996KB, bw=13164KB/s, iops=3290, runt= 59634msec write: io=263580KB, bw=4419.1KB/s, iops=1104, runt= 59634msec


Comments